
Figure 1.
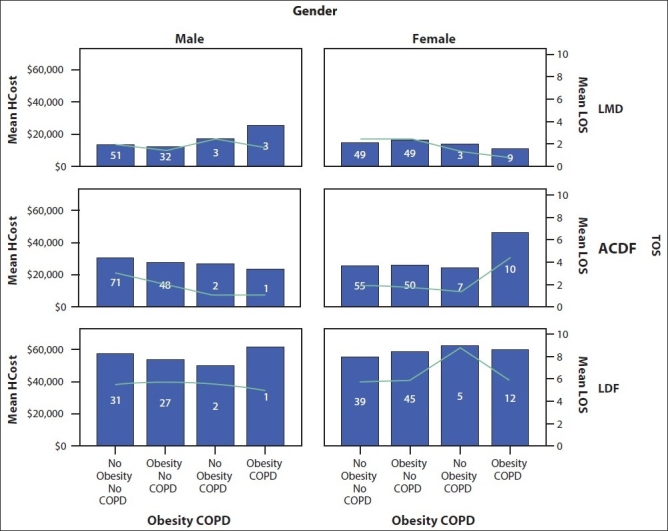
Bar diagram showing length of stay and hospital cost per gender, type of spine surgery, obesity and COPD status with the number of cases in each category (inside the bars)
Official websites use .gov
A
.gov website belongs to an official
government organization in the United States.
Secure .gov websites use HTTPS
A lock (
) or https:// means you've safely
connected to the .gov website. Share sensitive
information only on official, secure websites.
Bar diagram showing length of stay and hospital cost per gender, type of spine surgery, obesity and COPD status with the number of cases in each category (inside the bars)