Fig. 1.
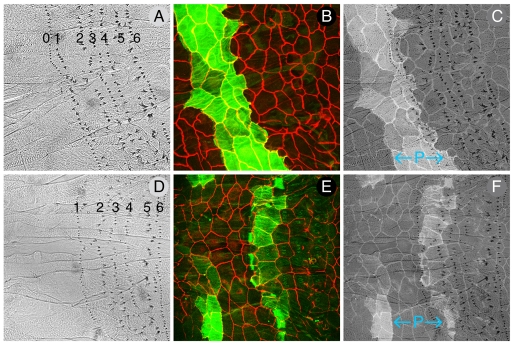
Specificity of the drivers. (A-C) When driven by en.Gal4, UAS.GFP::act (green) is found in the cells that make row 0 and 1 denticles. (D-F) When driven by ptc.Gal4, UAS.GFP::act (green) is found in the cells that make row 2 denticles (occasionally, cells that make row 3 denticles show weak expression). Cell boundaries are marked by Fasciclin 3 (red). Note that the registration shown between denticles and cells in the merges (C,F) is imperfect owing to the very different planes of focus; we estimate that it is accurate to about half of one cell diameter. The Gal4/UAS method gives variable levels of expression, perhaps explaining the discontinuity in the row of ptc expression at the back of the anterior (A) compartment. The extent of the posterior (P) compartment is indicated.

