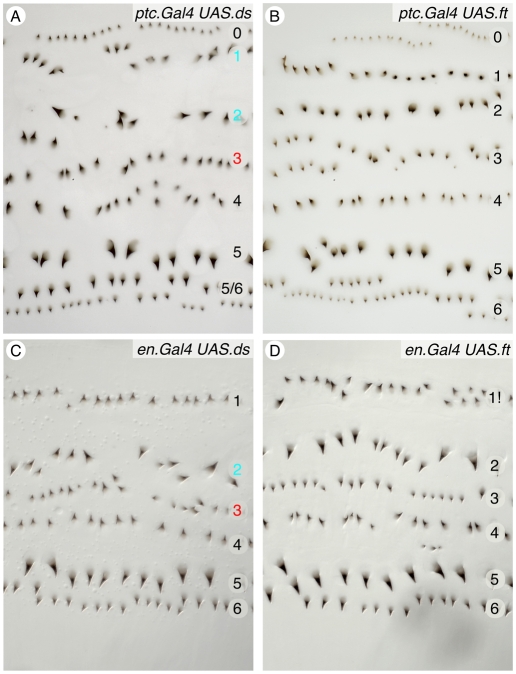
Fig. 4.
Effects of overexpressing ds and ft on denticle polarity. (A-D) Compare with Fig. 3, which shows the four outcomes diagrammatically. The loss of row 0 shown is rare in en.Gal4 UAS.ds (C) but common in en.Gal4 UAS.ft (D). For quantitation, see Table S1 in the supplementary material. For every row indicated by blue and red numbers (also in Fig. 5) there is a highly significant difference from the wild type ( ), whereas values in black are not significantly different (
 ). The effects we describe are thus consistent and conspicuous.

