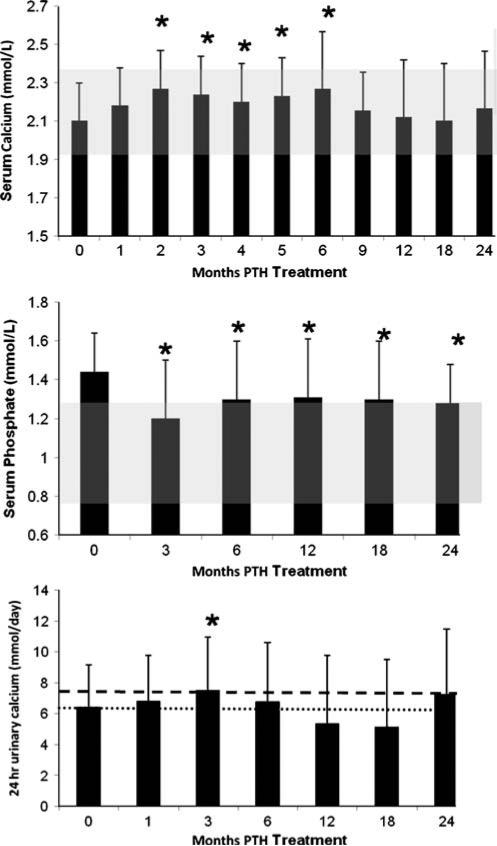
Fig. 3.
Changes in serum calcium, serum phosphate, and urinary calcium. Serum calcium increased at months 2 to 6 but was no different from baseline at 1, 9, 12, 18, and 24 months. Serum phosphate decreased into the normal range at month 3 and remained in the normal range through 24 months. The shaded area shows the normal ranges of serum calcium and phosphate. Urinary calcium increased at 3 months but, otherwise, did not change. The heavier and lighter dashed lines shows the upper limit of normal urinary calcium levels in men and women, respectively. Data are mean±SD; *p<0.05 as compared to baseline

