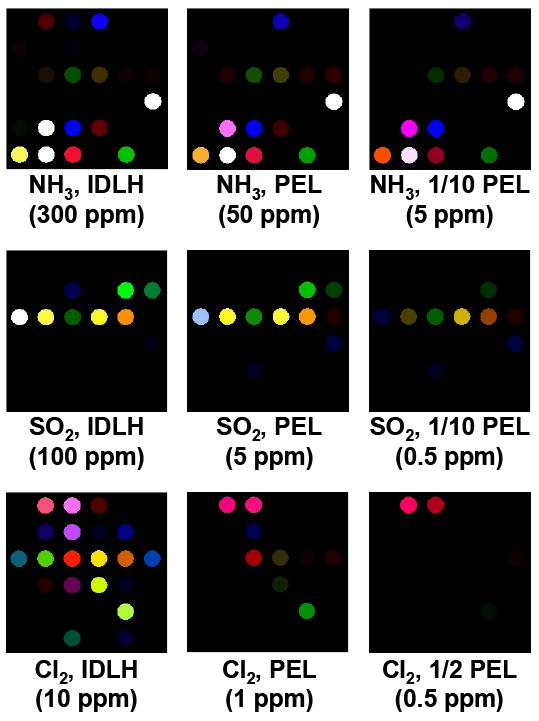
Fig. 5.

Color difference maps (averages of five trials each) of three toxic gases at different concentrations after 2 min of exposure. For purposes of visualization, the color range of these difference maps are expanded from 4 to 8 bits per color (RGB range of 4-19 expanded to 0-255). From the S/N ratio of the total Euclidean distances of these difference maps at the lowest concentrations tested, the estimated limits of detection are well below 100 ppb for each of these analytes.
