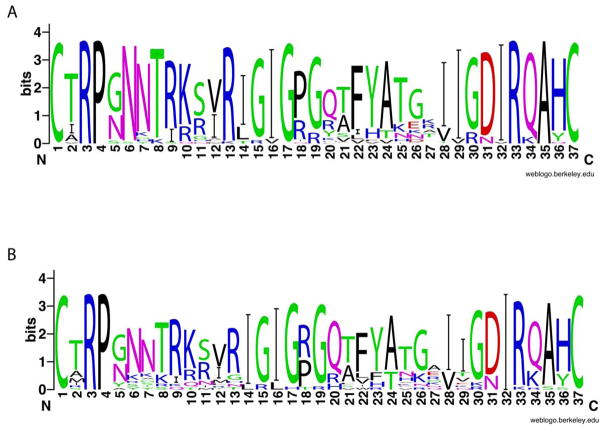
Figure 8. Sequence variation in the V3 region of HIV-1 subtype C R5X4 and X4 viruses from HIV-1 database and published literature.
The X axis indicates the amino acid position, whereas the symbol height (Y axis) indicates the relative frequency of each amino acid at that position of 36 R5X4 viruses (A) and 22 X4 viruses (B).

