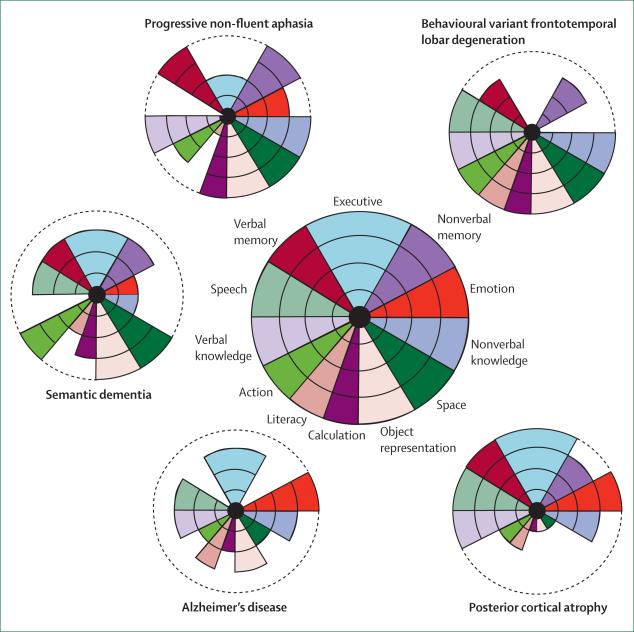
Figure 2. Neuropsychological signatures of young-onset dementia.
The target diagrams (based on McFie69) show neuropsychological profiles in a healthy individual (centre) and in patients with typical profiles from the range of young-onset dementias. Each sector of the target shows a particular cognitive domain. The distance along the radial dimension indicates the level of functioning, and the concentric lines indicate the percentile scores relative to a healthy age-matched population. Normal function in a cognitive domain is shown by colour extending to the perimeter of the target; loss of function is indicated by reduction of the coloured sector that corresponds to that cognitive domain. The neuropsychological profile of a particular disease is evident in the pattern of decline of cognitive functions: the differential loss of function across cognitive domains. These profiles define clinical syndromes but the correspondence with tissue pathology is variable between diseases; for example, whereas semantic dementia is closely associated with TARDBP-positive cellular inclusions, other tissue pathologies such as cerebrovascular disease or dementia with Lewy bodies have more variable clinical syndromes that overlap with those shown here. TARDBP=TAR-DNA binding protein (also known as TDP-43).

