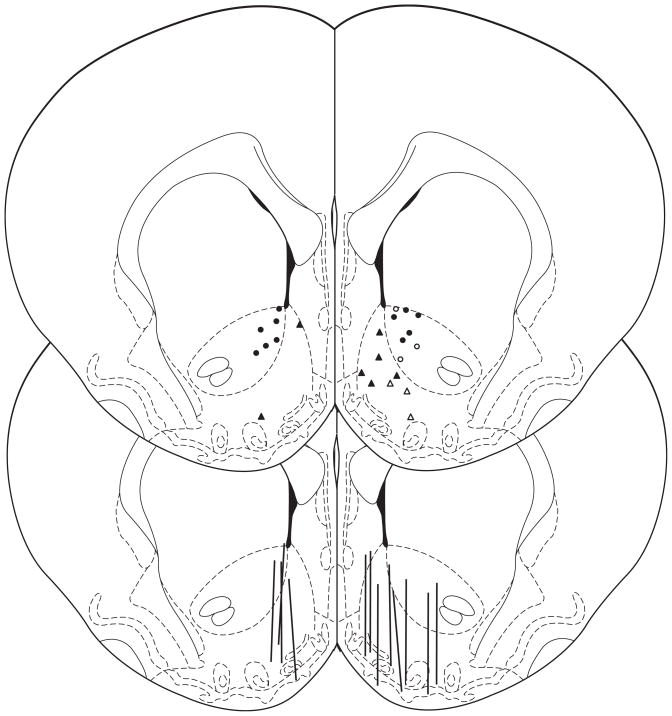
Figure 1.
Anatomical sites for voltammetric recording (circles, triangles) and microdialysis sampling (lines) in the NAc. For clarity, the saline groups are drawn on the left while the ethanol groups are on the right. Circles indicate core and triangles indicate shell sites for recording DA transients; open symbols indicate sites that were responsive to ethanol (i.e., exhibited significant increases in DA transient frequency after multiple ethanol infusions). The anterior/posterior position of the placements ranged from +1.0 to +2.2 mm anterior to bregma (slice shown is 1.7 mm anterior, adapted from Paxinos and Watson, 1998).

