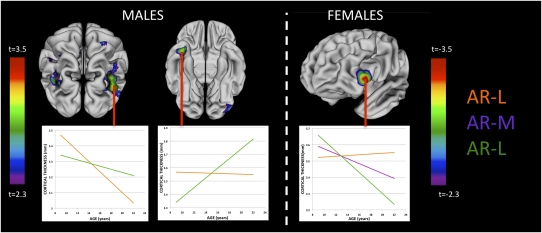
Fig. 2.
Vertex map indicates where the rate of cortical thickness change with age in males (Upper) and females (Lower) showed statistically significant differences between AR-CAG groups. Colors represent t statistic magnitude for the interacting fixed effects of age and AR-CAG genotype group in predicting cortical thickness. As indicated, “warmer” colors represent a more statistically significant difference in the rate of cortical thickness change with age between AR-CAG groups (vertex maps are corrected for multiple comparisons using a false discovery rate threshold of q = 0.1). (Insets) Examples of estimated average cortical thickness change with age for each AR-CAG genotype group. In males, other than a region in the left middle frontal gyrus, cortical differences in cortical thickness change with age in AR-H and AR-L groups qualitatively recapitulated differences in cortical thickness change with age between male and female subjects (Fig. S1). In females, within the IFG, a significant stepwise increase in the rate of age-related cortical thinning moving from lowest (AR-L), to intermediate (AR-M), to highest (AR-H) androgen receptor transductive capacity as inferred from AR-CAG genotype. As a result, AR-L females have borderline significantly thinner cortex than AR-H at age 9 y (P = 0.06), but significantly thicker cortex than AR-H by age 22 y (P = 0.004). In this same IFG region, the group-average rate of cortical thinning in males is greater than that in females (Fig. S1).

