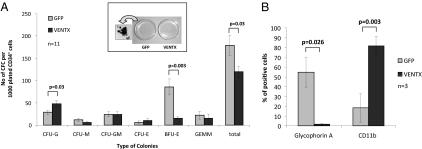
Fig. 3.
(A) Morphology of colonies and colony numbers derived from CB cells transduced with VENTX compared with the GFP control. Bars represent the average colony number of 11 independent experiments ±SEM. A macroscopic picture of primary colonies and magnification of one representative GFP+ colony are shown. (B) Immunophenotypic analysis of primary colonies by glycophorin A and CD11b staining. Bars represent the average percentage of positively stained cells ±SD.

