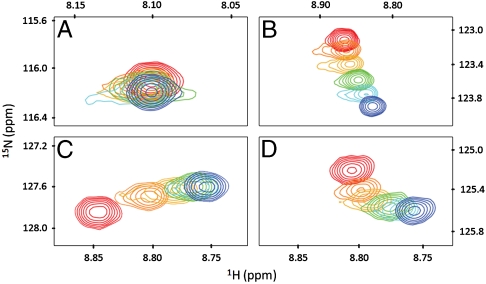
Fig. 4.
Examples of 15N-1H HSQC peaks from the Capto MMC titration experiments at 0 (red), 0.64 (orange), 1.28 (yellow), 1.92 (green), 2.56 (cyan), and 3.2 mM (blue) ligand concentrations. (A) Asn 60, a nonbinding residue, (B) Gln 2, a nonbinding residue that shows chemical shift changes, (C) Lys 6, a binding residue, and (D) Phe 45, a residue that exhibits multiphasic behavior.

