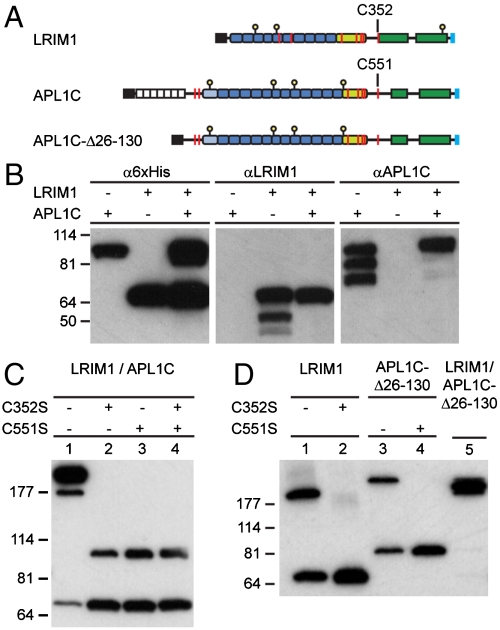
Fig. 1.
Coexpression of LRIM1 and APL1C and complex formation. (A) Schematic diagram of LRIM1 and APL1C constructs. Colored boxes: black, signal peptide; white, low-complexity; blue, LRR repeat; pale-green, cysteine-rich region; green, coiled-coil domain; and pale-blue, 6xHis tag. Features: yellow stalk, N-linked glycosylation site; red line, cysteine residue. (B) Individual and coexpression of full-length APL1C and LRIM1, reducing SDS/PAGE, Western blot with α6xHis, αLRIM1, and αAPL1 antibodies. (C) Coexpression of LRIM1/APL1C (lane 1), LRIM1-C352S/APL1C (lane 2), LRIM1/APL1C-C551S (lane 3), and LRIM1-C352S/APL1C-C551S (lane 4), nonreducing SDS/PAGE, and α6xHis Western blot. (D) Expression of LRIM1 (lane 1), LRIM1-C352S (lane 2), APL1C-Δ26-130 (lane 3), APL1C-Δ26-130-C551S (lane 4), and coexpression of LRIM1/APL1C-Δ26-130 (lane 5), nonreducing SDS/PAGE, α6xHis Western blot.

