
Table 3.
Mean actual cognition test scores according to timing of prenatal exposure to the Dutch famine
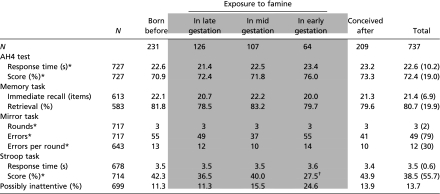 |
Data are given as means (SD) or *medians (IQR). Shaded areas indicate the groups exposed to famine during gestation compared with the control groups unexposed to famine during gestation.
†Statistically significant difference compared with participants unexposed to famine during gestation (based on linear regression analysis, P < 0.05, adjusted for sex).