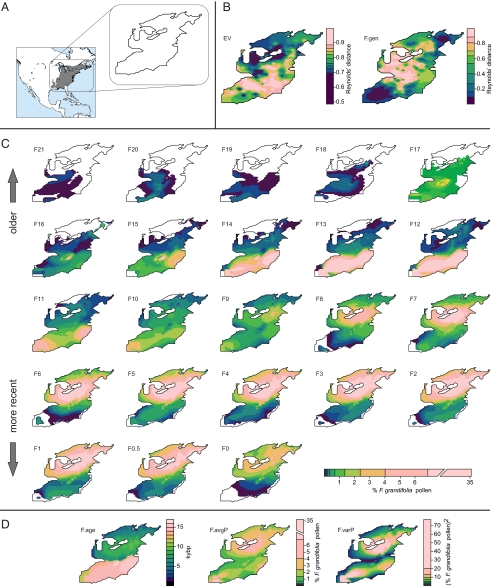
Fig. 2.
Genetic and fossil map layers of Epifagus virginiana and Fagus grandifolia. (A) Geographic range of both species. Outline shows extent of interpolated data layers. (B) Genetic distance maps for E. virginiana (EV) and F. grandifolia (F.gen). F. grandifolia genetic data are redrawn from McLachlan et al. (5). (C) Fossil pollen layers for F. grandifolia from 21 kyBP (F21) to present (F0) in 1,000-y increments. A pollen layer for 500 ybp (F0.5) is also shown. Pollen layers are redrawn from Williams et al. (6). (D) Summary pollen layers (F.age, F.avgP, and F.varP) of F. grandifolia as described in text. Warmer colors correspond with higher values in all maps. Maps were visualized using a 10-quantile color ramp.

