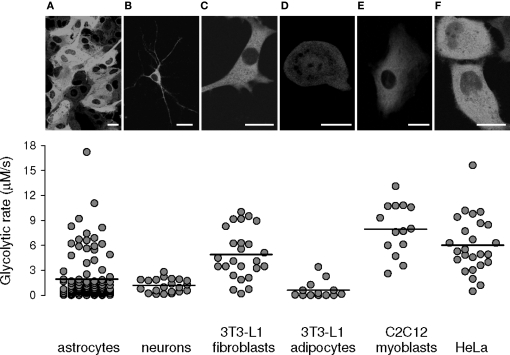
Figure 7.
Heterogeneity of glycolytic rates in various cell types. Confocal imaging of the glucose sensor expressed in astrocytes (A), neurons (B), 3T3-L1 fibroblasts (C), 3T3-L1 adipocytes (D), C2C12 myoblasts (E), and HeLa cells (F), displaying its expected cytosolic distribution, with exclusion of nuclei and organelles. Graphs summarize glycolytic rates obtained with ITM, with averages represented by a horizontal line (n > 14 cells in at least four experiments in each cell type).

