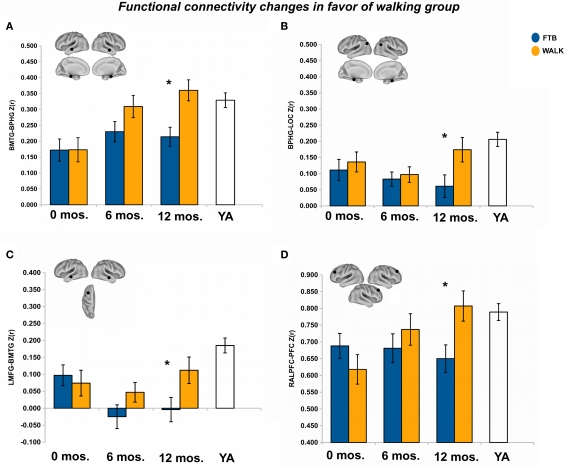
Figure 3.
Significant effects in favor of the walking group, in regions reflecting age-related network disruption, in the DMN. (A–C) and the FE network (D), are visualized by plotting marginal group means from the analysis at the corresponding time point (error bars represent 1 ± standard error of the marginal mean); *p < 0.05. Refer to Table 3 for anatomical description and MNI coordinates of ROIs represented by black circles. For all brains, R = R and L = L.

