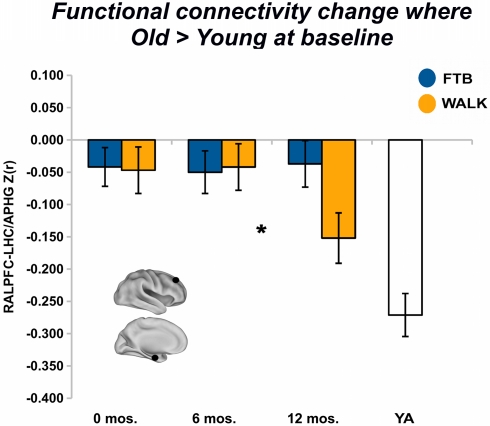
Figure 4.
Exercise training-related changes in functional connectivity in regions where old started greater than young. Significant effects, from FE network, visualized by plotting marginal group means from the analysis at the corresponding time point (error bars represent 1 + standard error of the marginal mean); *p < 0.05. Refer to Table 4 for anatomical description and MNI coordinates of ROIs represented by black circles. For all brains, R = R and L = L.

