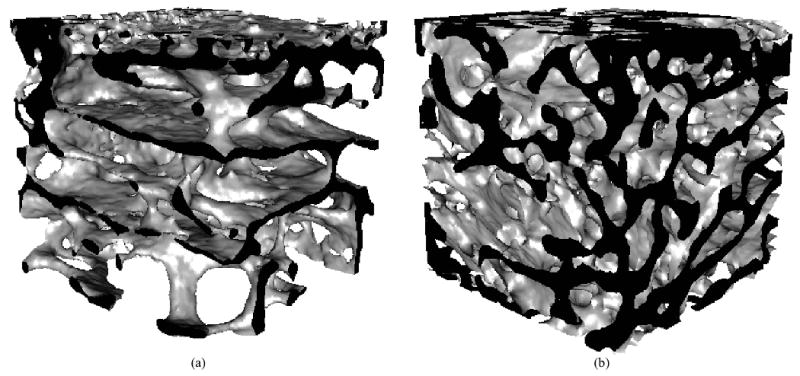
Figure 2.

Representative 3D reconstructions from microcomputed tomography scans of tissue below the loading core for (a) unloaded (BV/TV= 0.20) and (b) loaded (BV/TV=0.30) distal rabbit femora loaded to 1 MPa at 50 cycles/day for 4 weeks. A 3.5 mm cube is shown; the top surface was in contact with the loading core. The cut edges are shown in black.
