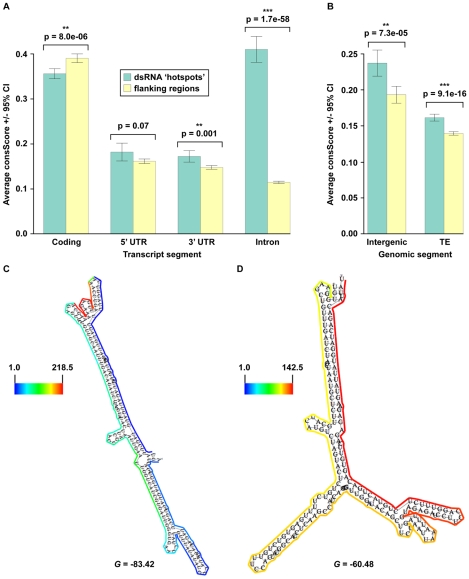
Figure 5. Identification of widespread, conserved functionality within non-coding portions of mRNA (introns, 3′ and 5′ UTRs), intergenic regions, and transposons.
(A, B) The average conservation scores (consScore) calculated using a seven-way comparative genomics analysis of dsRNA ‘hotspots’ (green bars) or their flanking regions (yellow bars) in specific portions (coding (exons), 5′ UTR, 3′ UTR, and introns) of pre-mRNAs (A), as well as intergenic regions and transposons (TE) (B). (C, D) Models of secondary structure for Arabidopsis (E) At1g67430 (nt 25262487–25262809) and (F) At2g40650 (nt 16964129–16964413) intronic functional moieties determined by dsRNA-seq constrained parameters for RNAfold (see below) (screenshots from the structural viewer at http://tesla.pcbi.upenn.edu/annoj_at9/). The scale bar to the left of each model indicates the read counts that are normalized by the length of sequenced bases for the transcript. The multiple alignments for these conserved, intronic dsRNA ‘hotspots’ can be seen in Figure S5A and S5B. G denotes the Gibb's free energy value (kilocalories/mole) for the corresponding RNA secondary structure model.

