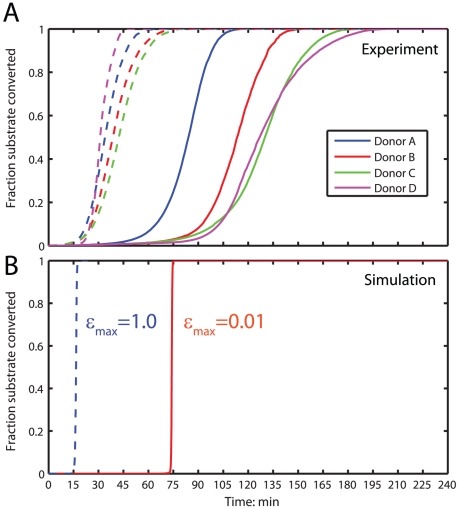
Figure 11. Simulating platelet activation.
(A) Mean substrate conversion across all replicates for the donors shown in
Figure 4
. Substrate conversion traces without platelet activation are shown in solid lines and conversion traces upon activated platelets are shown in dashed lines. (B) Setting the initial activation state  allows us to simulate platelet activation and its dynamic effect on all platelet dependent unbinding rates (see Methods). The red line indicates simulations of substrate conversion without prior platelet activation
  . The blue dashed line indicate simulations of substrate conversion upon instantaneously fully activated platelets at t = 0.
  .
.

