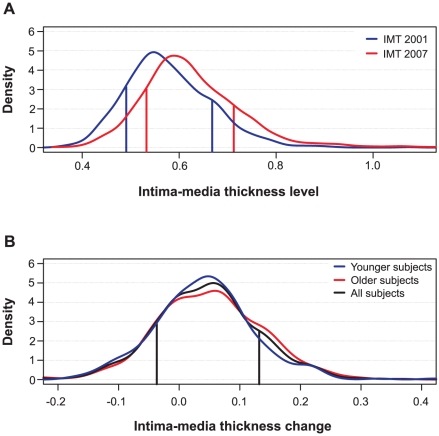
Figure 1. Distributions of intima-media thickness (IMT) of the study subjects.
(A) IMT levels in the baseline and follow-up studies in 2001 and 2007, respectively. (B) IMT changes from 2001 to 2007. The age-stratified distributions depict the baseline age groups of 24–30 and 33–39 years (Younger and Older subjects), as well as their combined distribution (All subjects). The vertical lines indicate the representative 15% and 85% quantile points (q) that divide the subjects into two risk groups: the low-risk class (subjects with the lowest q% of IMT levels or changes) and the high-risk class (subjects with the highest q% of IMT levels or changes).

