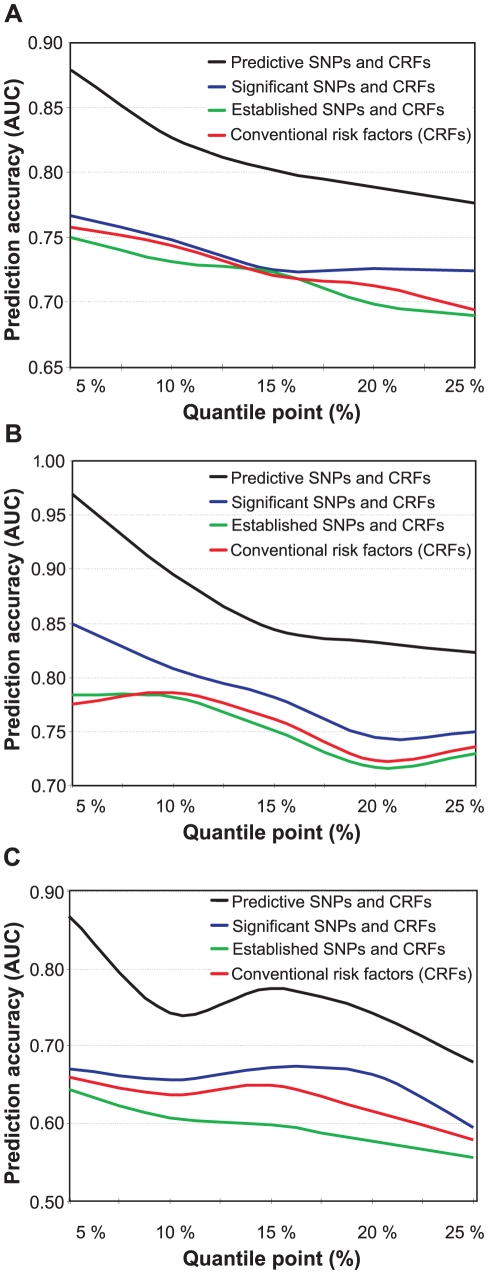
Figure 2. Prediction accuracy as a function of increasing risk classes.
The accuracy was defined using the area under the receiver operating characteristic curve (AUC), and the risk classes using the quantile points (5–25%). (A) Prediction of the baseline IMT risk classes in 2001 when using the conventional risk factors either alone, or when combined with the panel of 17 SNPs associated in previous studies with cardiovascular morbidity (Established SNPs), with those SNPs that are significantly associated with the low- and high-risk classes (Significant SNPs), or with the most predictive SNPs identified using the machine learning-based approach (Predictive SNPs). (B) Prediction of the follow-up IMT risk classes in 2007 using the baseline conventional and genetic risk factors measured in 2001. (C) Prediction of the IMT progression risk classes when using the baseline conventional and genetic risk factors measured in 2001 (the same as in (A,B)).

