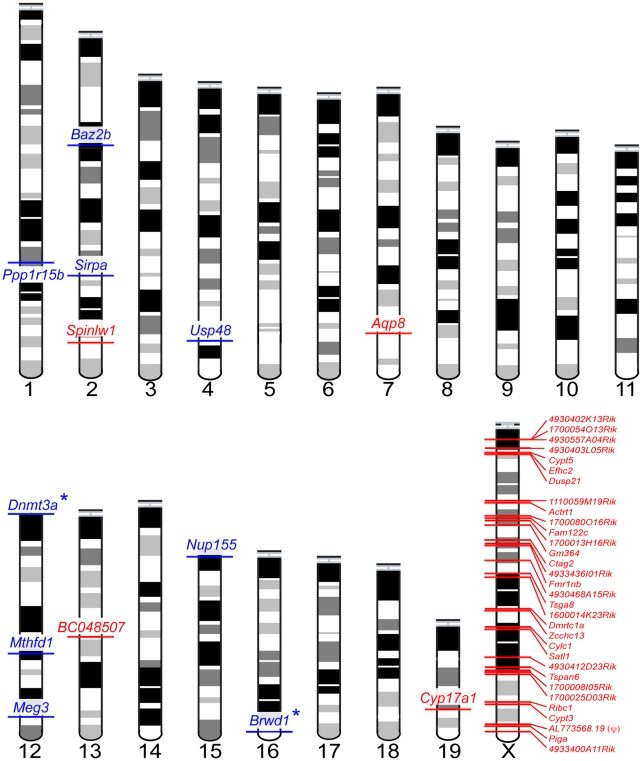
Figure 4. Forty-five sterility-correlated genes with patterns of expression robust to differences in testis cellular composition between fertile and sterile males.
Postmeiotic genes over-expressed in sterile males are shown in red, mitotic genes under-expressed in sterile males are shown in blue. Autosomal loci with known male sterility knockout phenotypes are indicated with an (*). One locus, AL773568.19(ψ), is a transcribed pseudogene.

