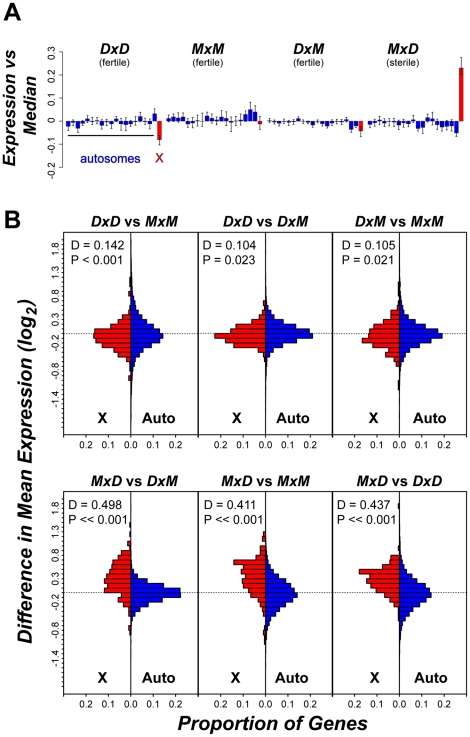
Figure 5. Over-expression of the X chromosome in sterile MxD hybrid mice.
(A) Average per chromosome deviation (log2 scale) for each genotype versus the median per gene expression across all 12 males. The 19 autosomes (blue) are presented sequentially with the X chromosome (red). (B) Distribution of pairwise expression differences for the X chromosome versus the autosomes. For each pairwise comparison, the proportional distribution of gene-by-gene differences in mean expression (log2) is shown for the X chromosome (red) and the autosomes (blue) with results from a Kolmogorov-Smirnoff test.

