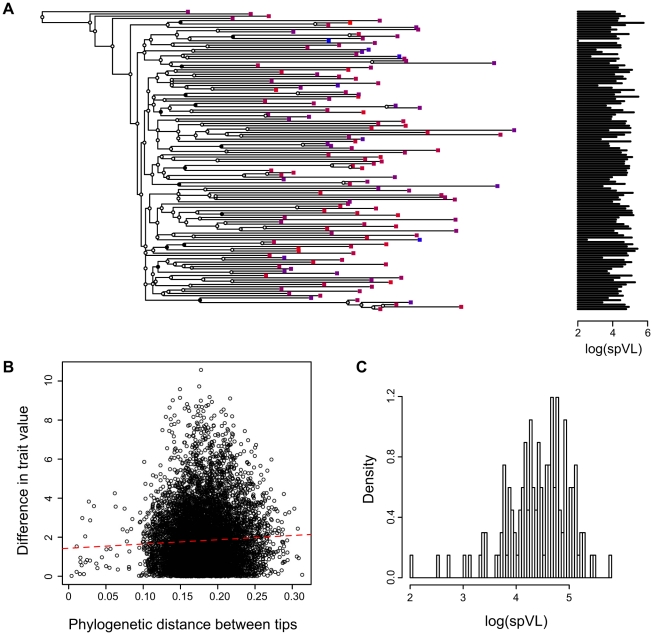
Figure 1. Combining phylogenies and trait values in the MSM strict dataset.
A) A phylogeny based on HIV sequences obtained from patients with known set-point viral loads, B) Phylogenetic distance between two tips versus difference in trait value between these two tips (slope and p-value
 ) and C) Distribution of log(spVL) values in the MSM strict dataset. Panel A shows the maximum likelihood phylogenetic tree built with the MSM strict dataset. Squares on the tips of the tree correspond to infected patients. The colour of the squares and the graph on the right indicate the set-point viral load (colours range from blue to red for increasing log(spVL)). The PCA tests the correlation between proximity in the phylogeny and trait values (log(spVL)). The circles on the tree nodes indicate bootstrap values: black is greater than 90%, grey is between 50 and 90% and white is lower than 50%.

