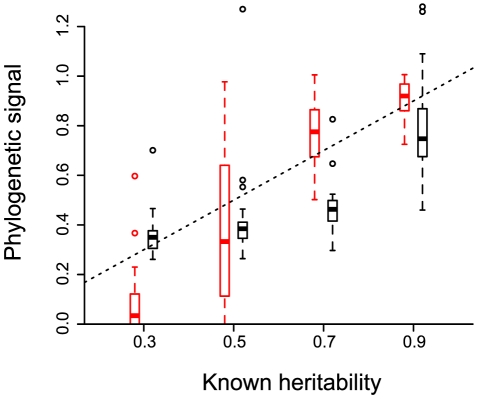
Figure 2. Phylogenetic signal estimated for evolutionary processes with known heritability.
20 phylogenies are simulated to model the evolution of an infection trait in a case where heritability is set to a given value. Phylogenetic signal ( in black and
  in red) is then estimated on each tree using only 128 leaves to account for incomplete sampling. The box plot shows the median values, the three quartiles and the outliers. The dashed line shows
  . The slope is
  (p-value
 and adjusted
  ) for
) for  and of
  (p-value
 and adjusted
  ) for
) for  .
.

