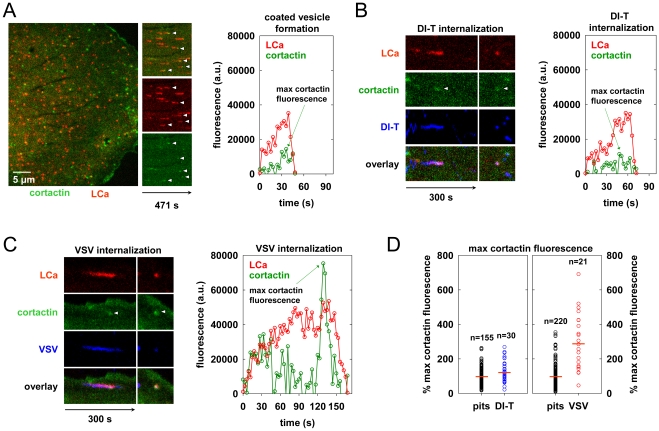
Figure 5. Clathrin structures containing VSV recruit more cortactin that pits that internalize DI-T.
(A) Cortactin recruitment during coated pit formation. Left, snapshot showing the surface of a BSC1 cell transiently expressing cortactin-eGFP (green) and mCherry-LCa (red) at 18 h post-transfection. Time-lapse images were acquired at 3 s intervals, and frame 83 is shown. Middle, split channel kymographs of coated pit formation in the cell at left. White arrowheads highlight pits in which cortactin recruitment is clearly visible above the local background. Right, example plot of cortactin and clathrin fluorescence intensity over time during the formation of a single clathrin-coated pit in the cell shown at left (Video S5). (B and C) Examples of cortactin recruitment during DI-T (B) and VSV (C) uptake. BSC1 cells transiently expressing mCherry-LCa (red) and cortactin-eGFP (green) were inoculated with Alexa Fluor 647-labeled DI-T or VSV, and images were acquired as in A. Left, split-channel kymograph views of protein and virion (blue) fluorescence intensity over time (Videos S6, S7). Images in the right-hand panels show a snapshot of the maximal cortactin or clathrin fluorescence, and white arrowheads highlight the peak cortactin signal. Right, plots of the cortactin and clathrin fluorescence intensity over time for each internalization event. (D) Relative peak fluorescence intensity of cortactin in cells co-expressing mCherry-LCa and cortactin-eGFP. At 18 h post-transfection, samples were separately inoculated with DI-T or VSV particles, and images were acquired as in A. For each cell that was imaged, the maximum cortactin fluorescence associated with ∼50 pits lacking virus particles (pits, black) and all pits that internalized a DI-T (left, blue, 3 cells) or VSV (right, red, 5 cells) particle was measured. The data are plotted as described in the legend of Figure 3C, and the number of events is shown above each plot. Numerical values and statistical analyses are provided in Table 1.

