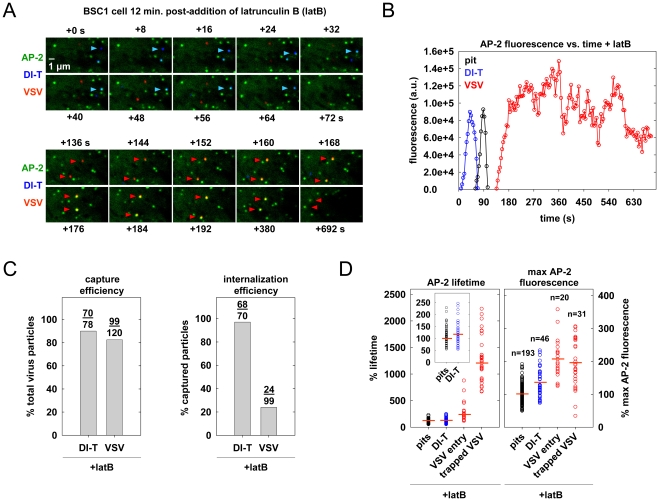
Figure 6. Actin polymerization is not required for DI-T internalization.
(A) The endocytic fate of virus particles after inhibition of actin polymerization. BSC1 cells stably expressing σ2-eGFP (green) were treated with 6.3 µM latB for 12 min. and inoculated with DI-T and VSV particles in the continued presence of latB. Time-lapse images of a single cell were acquired at 4 s intervals for 692 s, and an 8.8×5.0 µm2 area of the cell surface is shown. The upper panels show the complete internalization of a DI-T particle (blue, blue arrowheads), where +0 s indicates the first frame of the time-lapse series. The lower panels show the subsequent capture but failed internalization of 2 VSV (red, red arrowheads) particles on the same area of cell membrane (time scale continued from above) (Video S8). (B) AP-2 fluorescence intensity for the events shown in A. Note that the adaptor fluorescence associated with the DI-T particle (blue) and a conventional coated pit (black) that formed within the same membrane area peak and disappear normally, while the adaptor signal associated with the upper-most VSV particle (red) does not, signifying failed internalization. (C) Effect of latB on the efficiency of virus capture and internalization. BSC1 cells stably expressing σ2-eGFP were treated and imaged as described in A. Left, the percentage of virus particles that were captured by a clathrin structure after attachment. Right, the percentage of captured virus particles that were successfully internalized within 300 s of capture (see D. for details). Cumulative data are from 5 cells. (D) Effect of latB on the lifetime and peak fluorescence intensity of AP-2 in clathrin structures. Data were acquired as described in A. and displayed as in the legend of Figure 3C. Left, relative lifetime of AP-2 in structures that lack (pits, black) or capture a virus particle. Inset shows a rescaled distribution of the pit and DI-T internalization events. Right, maximum fluorescence intensity of AP-2 in the events at left. Data are from 4 of the 5 cells analyzed in C, as thermal drift during imaging prevented accurate fluorescence intensity measurements in one cell. The number of events in each category is shown above the corresponding plots at right. DI-T (blue) data consists only of productive internalization events. VSV events are categorized as productive internalizations (VSV entry, red) or non-productive captures (trapped VSV, red). A non-productive capture is defined as a stable colocalization between a spot of AP-2 and a VSV particle that began at least 300 s before the last captured image and did not result in virus uptake before cessation of imaging. The 300 s cutoff was chosen because a majority (22/24) of productive internalizations occurred within 300 s of capture. Captures in which the final image frame was acquired before 300 s elapsed were excluded from the analysis, as the eventual endocytic fate of the particle cannot be predicted.

