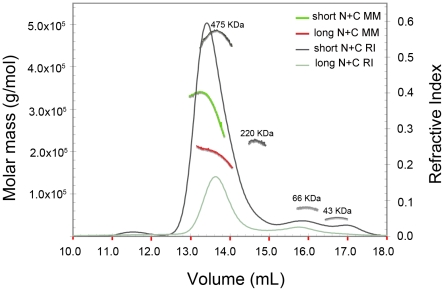
Figure 2. SEC-MALS analysis of mDia1 N+C complexes.
Molar mass and refractive index are plotted versus elution volume from a Superose 6 size-exclusion column for N+C complexes containing residues 131–458 with 736–1200 of mDia1 (short N+C, green trace) or residues 131–477 with 736–1200 of mDia1 (long N+C, red trace). Derived molar masses are presented in Table 1. Molecular weight standards are overlaid in dark gray and correspond to ovalbumin (43 kDa), BSA (66 kDa), BAM (220 kDa), and Apo (475 kDa). Analysis was performed in the Biophysics Resource of the Keck Center at Yale University.

