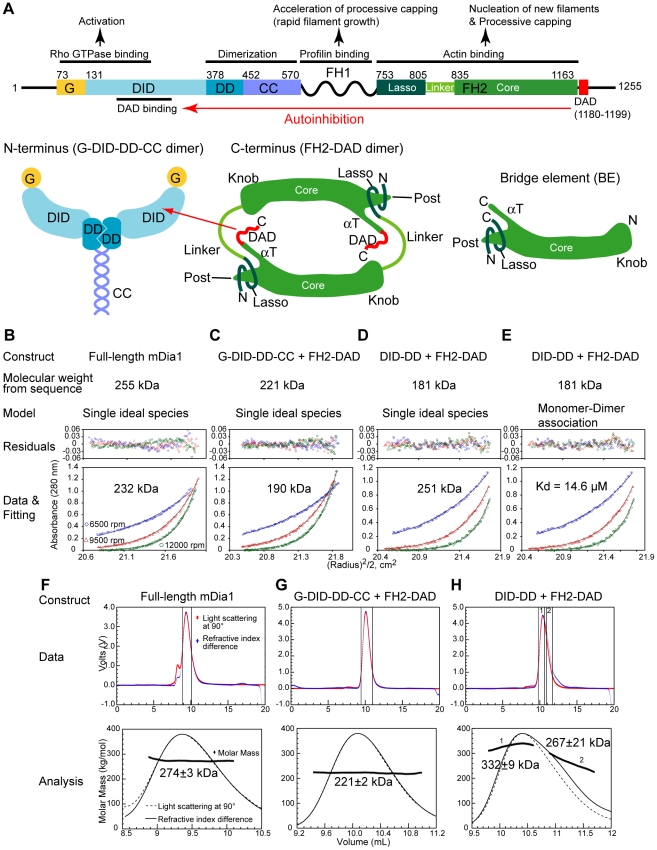
Figure 1. Domain organization and oligomerization of mDia1.
(A) Domain organization of mDia1. Abbreviations: G, GTPase binding region necessary for RhoA binding; DID, Diaphanous inhibitory domain; DD, dimerization domain; CC, coiled coil; FH1, formin homology 1 domain; FH2, formin homology 2 domain; DAD, Diaphanous autoinhibitory domain. (B-E) Sedimentation equilibrium analyses of (B) full-length protein, (C) the G-DID-DD-CC•FH2-DAD and (D, E) the DID-DD•FH2-DAD complex. Representative data recorded for each protein/complex with a sample concentration of 14 µM at 6500 (blue diamonds), 9500 (red triangles), and 12000 rpm (green circles) are shown. The curves were fitted with single ideal species or monomer model in (B-D) and monomer-dimer equilibrium model in (E), respectively. In (E), the molecular weight of the monomer was fixed to 181kDa, which corresponds to the sum of two chains of each of DID-DD and FH2-DAD. The dissociation constant obtained from the fitting is 14.6 µM. Above these data are the residuals between the data and the fitted lines. (F-H) Size exclusion chromatography (Superdex 200) coupled multi-angle static light scattering experiments for (F) full-length protein, (G) the G-DID-DD-CC•FH2-DAD and (H) the DID-DD•FH2-DAD complex. Representative signals from the 90° detector (red) and refractive index differences (blue) are shown (upper panels). The two vertical solid lines indicate the regions used for calculating average molar mass (upper panels). The calculated molecular weights for each data point are shown as black diamonds in the expanded pictures of the selected regions (lower panels). 500 µl of total 25 µM protein were injected.

