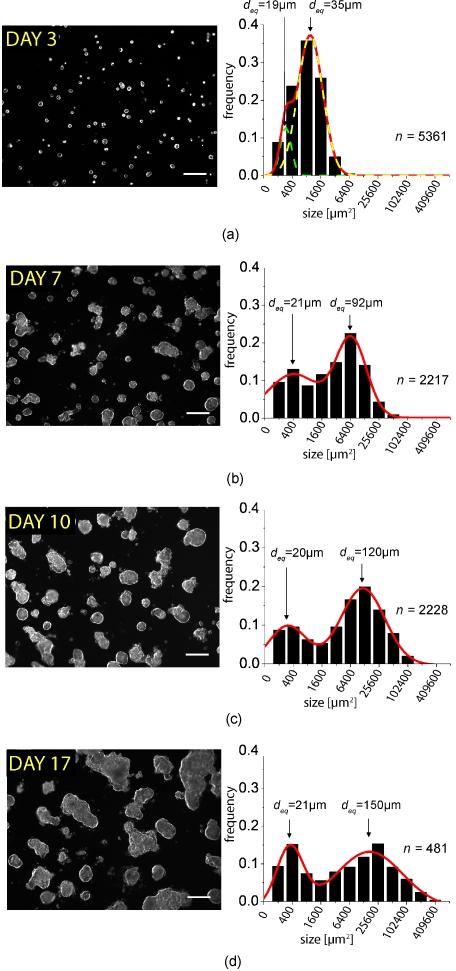
Figure 1.
Representative dark-field microscopy images of in vitro 3-D acini and corresponding size distribution histograms and Gaussian fits from analysis of image data obtained at (a) day 3 following plating and (b) day 7, (c) day 10, and (d) day 17. The n values on the right of each histogram indicate the number of nodules included in each histogram. Scale bars=250 μm.

