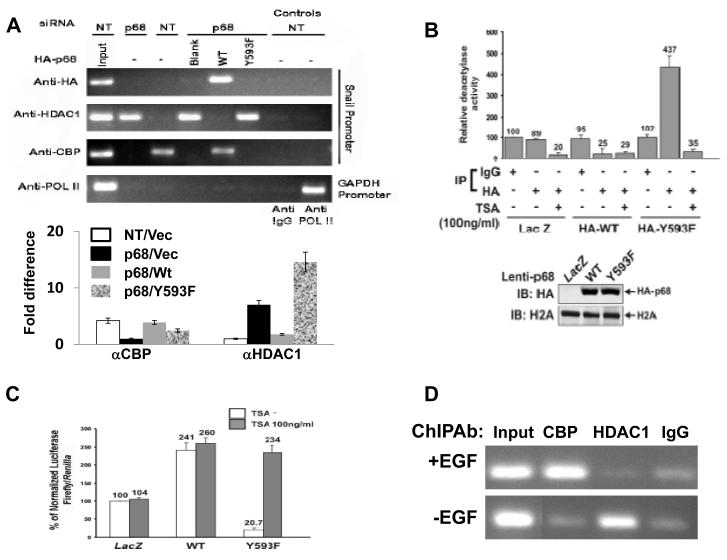
Figure 4.
Phosphor-p68 dissociated HDAC1 from the Snail1 promoter.
(A) ChIP of the Snail1 promoter using Anti-HA (HA), anti-HDAC1 (HDAC1), and anti-CBP (CBP) antibodies in SW620 cells. SW620 cells were treated with p68 siRNA (p68) or non-targeting siRNA (NT). HA-p68s (WT or Y593F mutant) or empty vector (Blank) was exogenously expressed in p68 knockdown cells. Inputs were PCR products from SW620 DNA extracts without ChIP. ChIP assays with IgG were the negative controls. ChIP of GAPDH promoter in the cells using anti-POL II (POL II) antibody was a control ChIP experiment. (A, Lower panel) Quantization ChIP results by real-time PCR. The ChIP quantization is expressed as fold difference by defining the lowest ChIP value in each antibody group (αCBP or αHDAC1) as 1 after normalizing ChIP value in each antibody group to the inputs within the group. The error bars represent standard deviation of results from three independent measurements. NT/p68 means the cells were treated with non-target or p68 target RNAi. Vec, wt, or Y593F represents p68 wt, Y593F mutant, or vector was expressed in the cells. (B) Deacetylase activities of co-immunoprecipitates by mouse IgG (IgG, as control IP antibody) and anti-HA antibody (HA) from cellular extracts made from SW620 cells were analyzed. HA-p68s (WT or Y593F mutant) were stably expressed using Lenti-viral system. LacZ is a control expression protein. The immunoprecipitates were treated/untreated (+/−) with 100 ng/ml of TSA. The deacetylase activity (numbers on top of bars) was expressed as relative deacetylase activity by define the activity of co-IP by mouse IgG without TSA treatment without HA-p68 expression as 100. The upper panel is IB analyses of stable expression of HA-p68 in SW620 cells. IB of H2A is a loading control. (C) Luciferase reporter of the Snail1 promoter was transfected into SW620 cells in which HA-p68, wt or mutant (indicated) was stably expressed. Twenty four hours post transfection, cells were treated/untreated (filled bars/open bars) with TSA (100 ng/ml) overnight. Luciferase activities were then analyzed. The luciferase activity was expressed as relative luciferase activity (numbers on top of bars) by compared to the luciferase activity of SW620 cells without HA-p68s expression and TSA treatment (define as 100). (D) ChIP of the Snail1 promoter using anti-HDAC1 (HDAC1) and anti-CBP (CBP) antibodies in SW480 cells that were treated (+EGF) or untreated (−EGF) (EGF 15 ng/ml). ChIP using rabbit IgG was a control ChIP experiment. In (B) and (C), the error bars represent standard deviation of results from three independent measurements.

