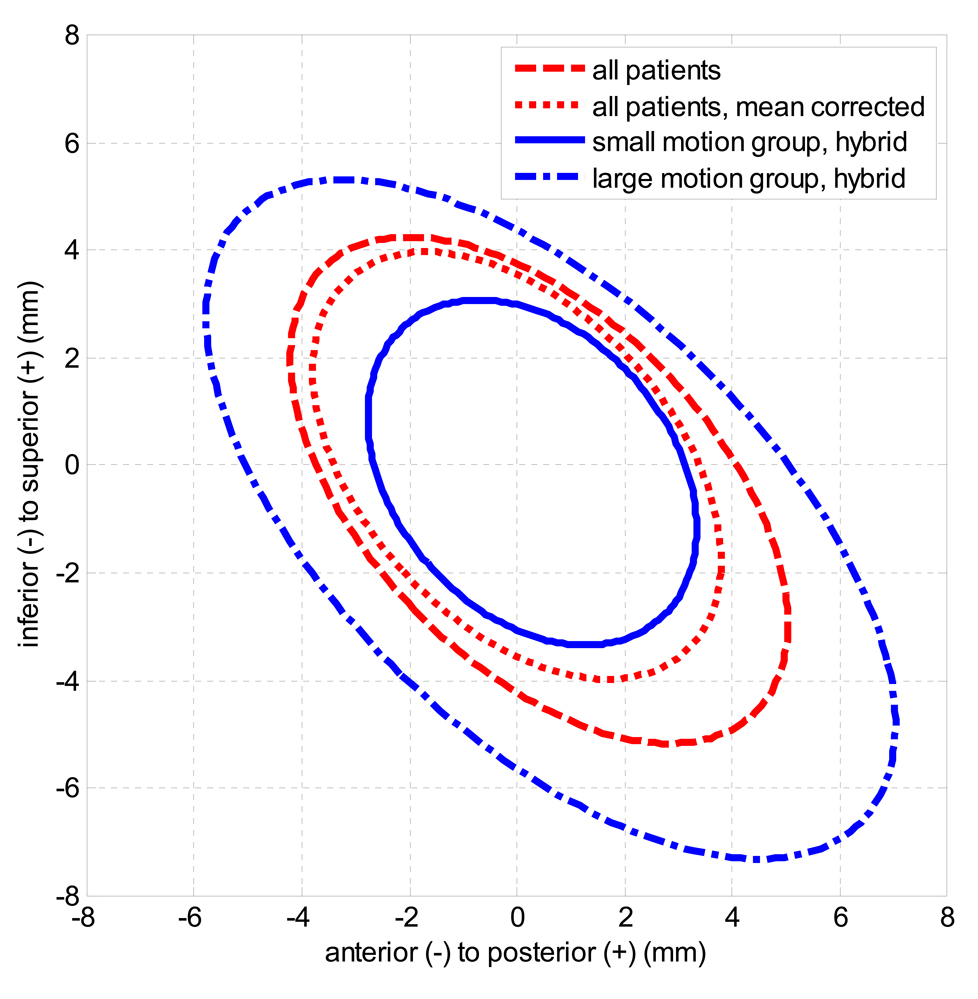
Figure 6.
Ellipses containing 90% of measured displacements from the plan in the AP and SI-axes, for the entire population with and without the patient specific systematic error corrected, and for the small and large motion groups defined using the hybrid strategy. A bivariate normal probability distribution was assumed for each ellipse.

