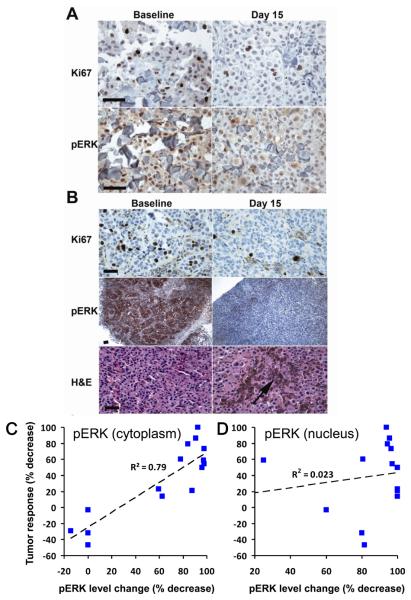
Fig 3. Semi-quantitative immunohistochemistry in paired tumor biopsies.
Matched baseline and day 15 tumor samples are at the same magnification; the measurement bar is 70 μm.
A. Representative IHC for Ki67 and pERK staining is shown for patient 12.
B. Representative IHC for Ki67, pERK and H&E staining is shown for patient 42. The arrow indicates tumor breakdown with macrophages engulfing the released melanin in the day 15 sample.
C. Summary graph showing correlation of reduction in cytoplasmic pERK with tumor responses (data from Supplementary Table 2).
D. Summary graph indicating weak correlation of reduction in nuclear pERK with tumor responses.

