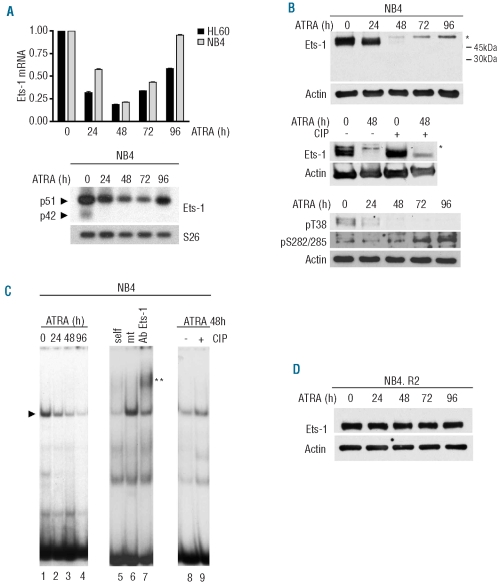
Figure 1.
ATRA reduced p51 Ets-1 expression and DNA binding affinity in NB4 and HL60 cells but not in their ATRA-resistant counterpart. NB4 and HL60 cells were treated with 10−6M ATRA and collected at the indicated time points. (A) (Top) Ets1 expression by qRT-PCR. GAPDH endogenous control was used for normalization. Error bars represent standard deviation and indicate the average values from three independent experiments. (Bottom) Semi-quantitative RT-PCR of alternatively spliced isoforms of Ets-1 mRNA in NB4 cells. S26 was used for normalization. (B) (Top) Western blot of Ets-1 protein during ATRA-induced differentiation of NB4 cells and (middle) after CIP treatment. Asterisks represent the size shift of the phosphorylated protein. (Bottom) Western blot using antibodies against Ets-1 pT38 or pS282/285. (C) EMSA of untreated and ATRA-treated NB4 cells (lanes 1–4). Complex formation is indicated by arrows. Extracts were incubated with a 200-fold molar excess of wild-type (lane 5) or mutated (lane 6) cold DNA competitors and anti-Ets-1 antibody (lane 7). The double asterisk indicates the supershift of the complex. EMSA of cell extracts untreated (lane 8) and treated with CIP after 48 h of exposure to ATRA (lane 9). (D) western blot of Ets-1 in ATRA-treated NB4.R2. In all Western Blots, equal loading was confirmed by probing with anti-actin antibody.

