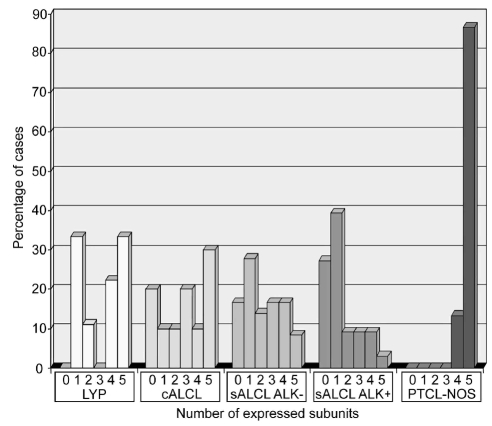
Figure 2.
Bar chart of the TCR/CD3 complex expression data. For each entity, the percentage of cases that express a certain number of subunits (TCRβ, CD3δ, ɛ, γ, ζ) is plotted. Only cases for which expression data for all five TCR/CD3 subunits could be obtained are included [9 cases of lymphomatoid papulosis (LYP), 10 of cutaneous ALCL (cALCL), 36 ALK- systemic ALCL (sALCL), 33 ALK+ systemic ALCL (sALCL), 15 PTCL-NOS].

