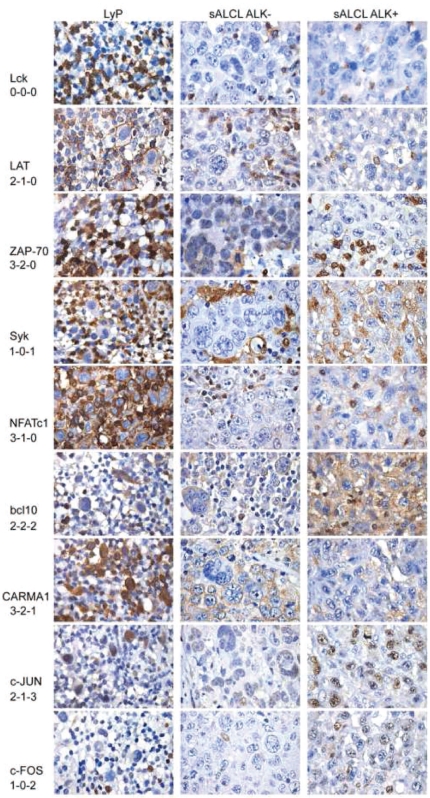
Figure 4.
Immunostaining of TCR/CD3 complex-associated signal transduction molecules. The left column shows characteristic staining results for lymphomatoid papulosis, the middle column shows results for an ALK− systemic ALCL, and the right column shows results for an ALK+ systemic ALCL. Scoring results are provided below the respective molecule (from left to right).

