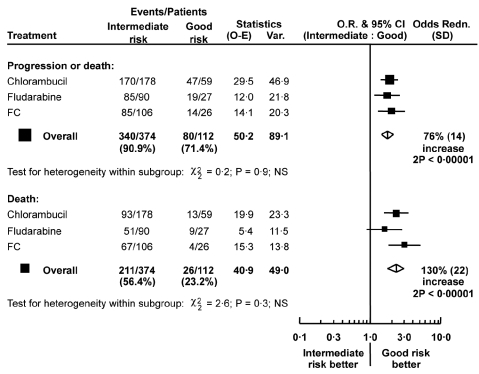
Figure 4.
Effect of risk group on progression-free survival and overall survival within the randomized treatment arms. The squares and lines show the estimated odds ratio and their 95% confidence interval (95% CI). The size of each square is proportional to the amount of information in the subgroup. Overall estimates are shown by a diamond, with the width representing the 95% CI. O-E: observed minus expected; V: variance; NS=not significant.

