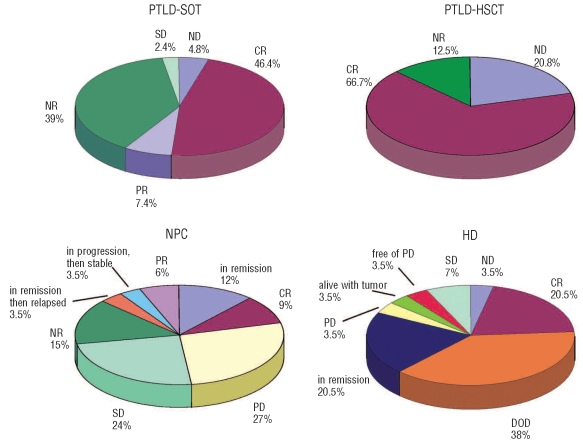
Figure 2.
Diagrams show responses to treatment with EBV-specific CTL in patients with PTLD after SOT (total patients treated, 41), PTLD after HSCT (total patients treated, 24), NPC (total patients treated, 33), and HD (total patients treated, 21). CR: complete response; SD: stable disease; PD: progressive disease; NR: no response; PR: partial response; DOD: died of disease; ND: no data.

