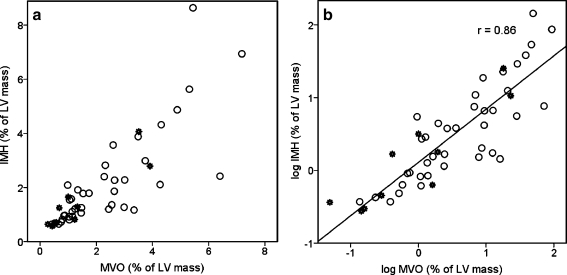
Fig. 1.
Correlation between IMH and MVO. a Original scale values. b Log transformed values. A good linear correlation is seen between MVO and IMH (r = 0.86, p < 0.001). Open circles indicate observed values and stars indicate predicted values in the MVO(+)/IMH(-) group. Note that most of the predicted values are within the lower range of observed values

