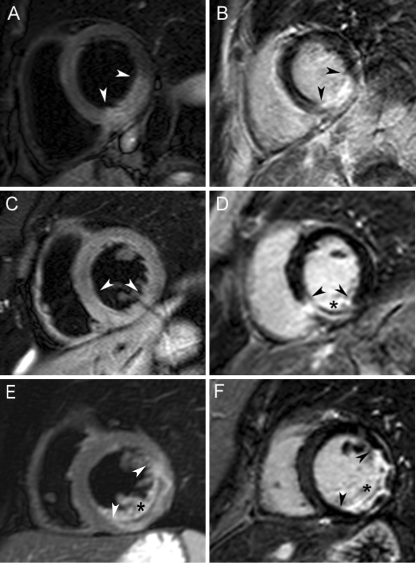
Fig. 2.
Magnetic resonance image examples from each patient group. Top row (a, b): MVO(−)/IMH(−) patient; middle row (c, d): MVO(+)/IMH(−) patient; bottom row (e, f): MVO(+)/(IMH(+) patient. T2-weighted images are shown on the left (a, c, e) and corresponding late gadolinium-enhanced images on the right (b, d, f). Oedema and infarct border zones are indicated by arrowheads and IMH and MVO by asterisks

