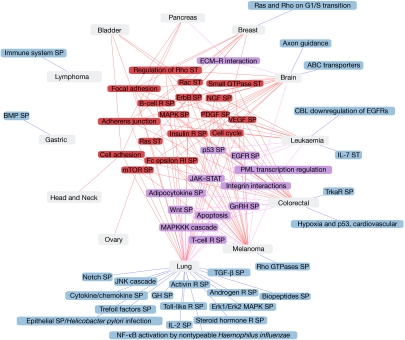
Figure 1.
Altered cellular pathways and processes in tumours. Graphic representation of cellular pathways/processes containing a significant number of mutated genes (Q-values <0.01) among tumour types (Methods section). Cellular pathways containing a significant number of mutated genes in four or more tumour types are depicted in red, in two or three tumour types in violet, and in only one tumour type in blue. ECM, extracellular matrix; R, receptor; SP, signalling pathway; ST, signal transduction.

