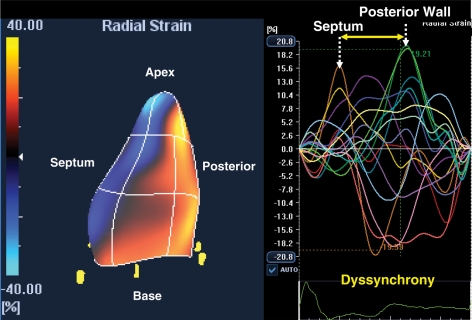
Figure 4.
An echocardiographic image from a patient with left bundle branch block of three-dimensional speckle tracking strain acquired from a pyramid of data with colour coding of peak strain as orange–yellow. The right panel shows 16 corresponding time-strain curves from standard left ventricular segments demonstrating septal curves with early activation, and free-wall curves with late activation, consistent with significant mechanical dyssynchrony.

