
Figure 4.
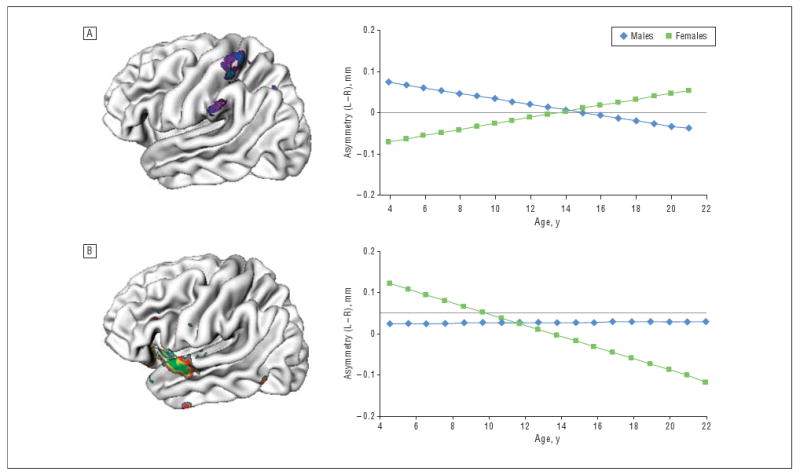
Regions where there was a significant interaction of sex with changing asymmetry. A, Regions where males had a greater decrease with age in asymmetry (left [L] minus right [R]), indicating relative right-hemispheric gain; females showed the opposite pattern of an increase with age in asymmetry, indicative of a relative left-hemispheric gain. B, Superior temporal region where the reverse pattern occurred.