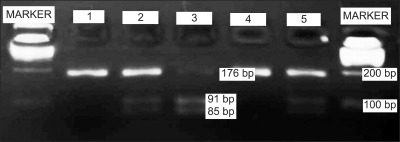
Fig. 2.
Photograph of the PCR products of the glutathione S-transferase P1 (GSTP1) gene after Alw 26 I enzyme cutting and on 3.5% agarose gel. Line MARKER shows the 100 bp DNA ladder, line 1 and 4 shows individuals with Ile/Ile genotype (176 bp), line 2 and 5 shows Ile/Val genotype (176 bp, 91 bp, 85 bp), and line 3 shows the Val/Val genotype (91 bp, 85 bp).

