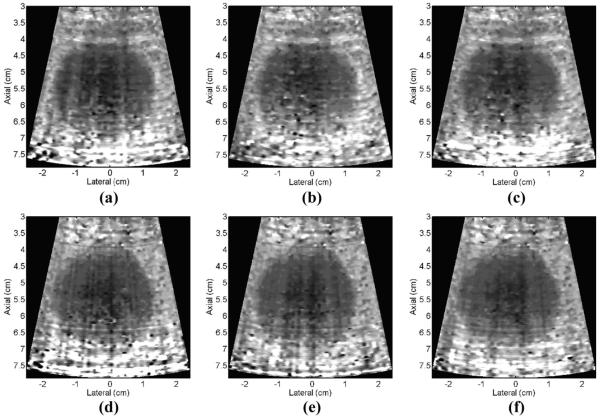
Fig. 15.
ARFI images of a lesion in a CIRS elastography phantom mimicking liver tissue 0.8 ms after radiation force excitation using 57% (a), 67% (b and d), 77% (c and e), and 87% (f) of the maximum system voltage for the radiation force excitation. Top row: PZT4, 3-layer composite array, bottom row: PZT5-H, single-layer control array.

