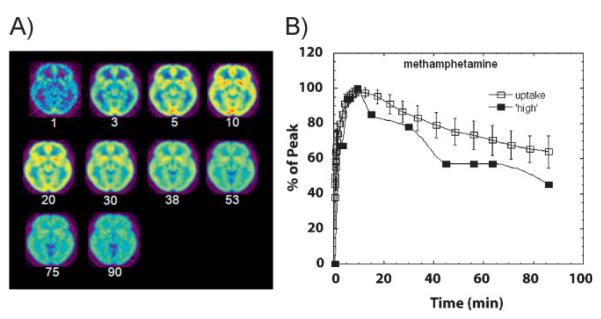
Figure 2.
A: Axial brain images of the distribution of [11C]methamphetamine at different times (minutes) after its administration. B: Time activity curve for the concentration of [11C]methamphetamine in striatum alongside the temporal course for the “high” experienced after intravenous administration of pharmacological doses of methamphetamine. Modified with permission from Fowler et al. [55].

