
Figure 1.
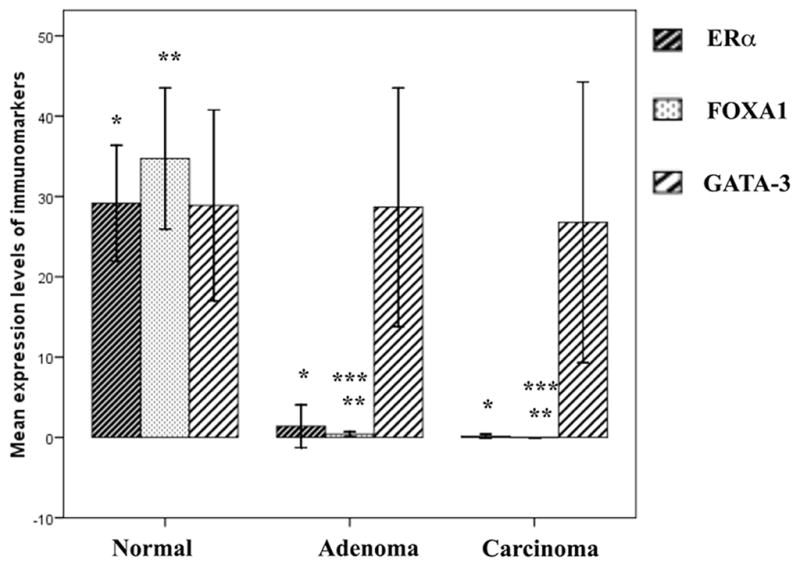
Graph (mean ± SE) demonstrating sequential loss of ERα, FOXA1 and GATA-3 in various stages of tumor progression in PyMT transgenic mouse model. Although, the expression levels of ERα and FOXA1 are negligible in late stages, we observed a persistence of GATA-3 expression even in late stages of tumors. *, **normal vs. adenoma or carcinoma for ERα and FOXA1 p<0.0001. ***FOXA1, adenoma vs. carcinoma p=0.034. Differences in GATA-3 expression were not significantly different (p=0.157).