Figure 3.
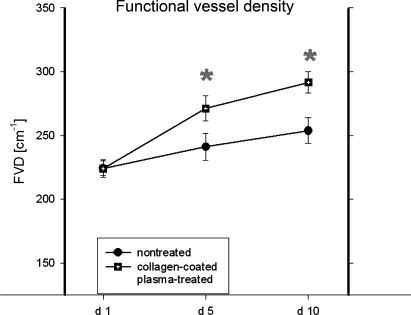
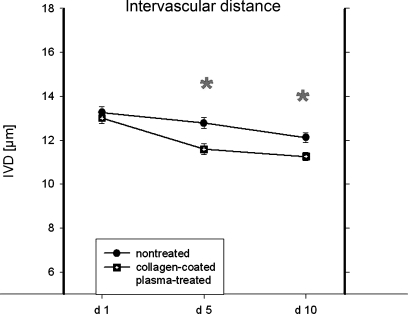
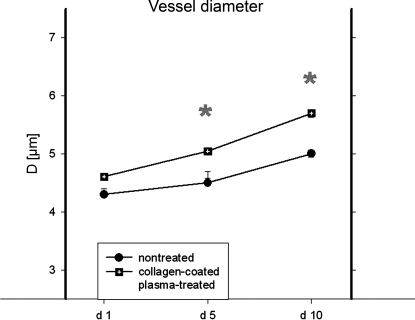
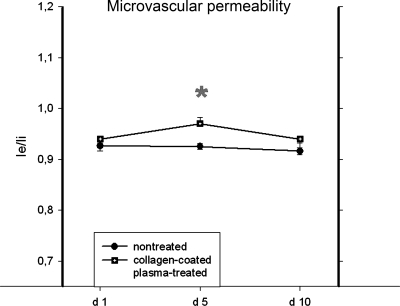
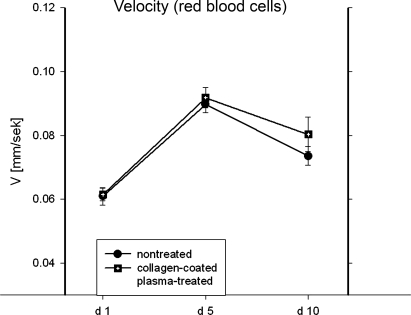
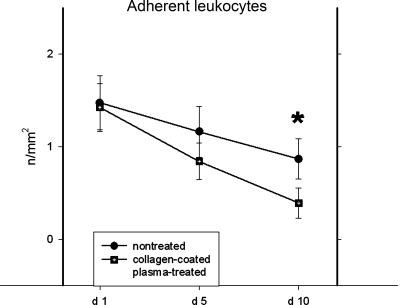
The graphs display the quantification of standard microcirculatory parameters. (a) Increasing functional (perfused) vessel density (FVD) was noted within the border zones of untreated and coated implants throughout the experiment. The differences among the groups reached statistical significance on days 5 and 10. (b) The assessment of vessel diameter (VD) demonstrated significantly increased values for the treatment group on days 5 and 10. (c) The examination of the intervascular distance demonstrated a progressive and significant reduction from day 1 to day 10 in both groups. (d) The analyses of red blood cell velocity revealed a stable perfusion of the blood-vessel network in implant adjacent tissue. (e) The microvascular permeability was found to be significantly increased on day 5 in treated implant group as compared with controls. (f) The examination of the leukocyte-endothelium interaction showed that the quantity of leukocytes adhering to vessel walls decreased from day 1 to day 10. Significant differences between the groups were found on day 10 (t test, P < .05).

