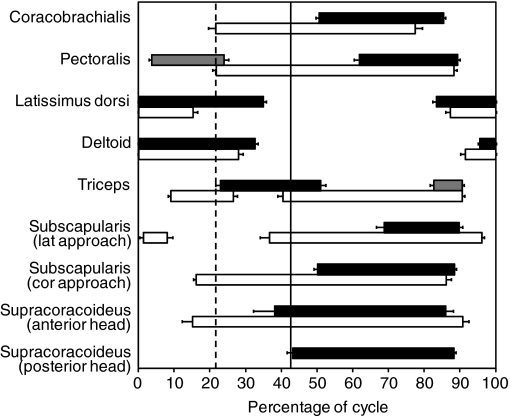
Fig. 4.
Bar plot showing patterns of forelimb muscle activation during swimming and walking in Trachemys scripta. Bars represent the mean and standard error for the period of activity for each muscle. Solid bars represent swimming, open bars represent walking, and gray bars represent variable bursts of muscle activity observed during swimming that were not present in every trial. Vertical lines demarcate the switch from protraction to retraction for walking (dashed line) and swimming (solid line). The x-axis shows the percentage of the limb cycle from 0 to 100%. ‘Cor approach’ indicates that the electrode was implanted into the muscle by inserting it more posterior and laterally (as if approaching the coracobrachialis). ‘Lat approach’ indicates the electrode was implanted into the muscle by inserting it more anteriorly (as if approaching the latissimus dorsi). Note that data from the posterior head of the supracoracoideus were only obtained during swimming; this does not, however, indicate that there was no activity during walking.

